The Efficacy of the Connect America Fund (CAF) in Addressing US Internet Access Inequities
Residential fixed broadband internet access in the US remains inequitable, despite significant taxpayer investment. This paper evaluates the efficacy of the Connect America Fund (CAF), which subsidizes new broadband monopolies in underserved areas to provide internet access comparable to that in urban regions. CAF’s oversight relies heavily on self-reported data from internet service providers (ISPs). Unfortunately, the reliability of this self-reported data has always been open to question. We use the broadband-plan querying tool (BQT) to create a novel dataset that comple- ments ISP-reported information with ISP-advertised broadband plan details from publicly accessible websites for 537k residential addresses across 15 states. Our analysis reveals significant discrepancies, with a serviceability rate of only 55.45%, indicating that a significant fraction of addresses certified as served are still unserved. Furthermore, we observe a compliance rate of only 33.03%, indicating that a significant fraction of served addresses receive download speeds that are non-compliant with the FCC’s 10 Mbps threshold for CAF- served addresses. Although we observe that CAF-served addresses occasionally receive higher download speeds than their monopoly-served neighbors, overall, the CAF program has largely failed to achieve its intended goal, leaving many targeted rural communities with inadequate or no broadband connectivity.
Specifically, we aim to answer the following questions: (1) Do ISPs genuinely offer broadband internet access to the addresses CAF aims to serve? (2) Do ISPs satisfy the rate and service quality standards specified for this program? (3) Do the regulated monopolies created through this program offer better broadband service than unregulated monopolies? That is, do the conditions placed in exchange for public subsidies through CAF curb an ISP’s monopoly powers and thus offer meaningful improvements in the value that consumers receive?
This work has been accepted for publication in the upcoming ACM SIGCOMM 2024 conference. Read the full paper here for more details about the technical details of our data collection and analysis methodology.
Our article “Measuring Broadband Policy Success” recently got published by the Harvard Law Review. Read the full article here. This article summarizes our findings on assessing the efficacy of the $10 billion Connect America Fund (CAF) Program for audiences in the law and policymaking domain.
The CAF program subsidizes the creation of new regulated broadband monopolies in underserved areas, aiming to provide internet access comparable in price and speed to that available in urban regions. Regulators rely on certifications from ISPs to assess the program’s success. According to this self-reported data, the program has been a huge success.
However, our analysis, based on data curated by querying the actual plans ISPs are advertising to these addresses, shows that a significant fraction of addresses covered through this program are still unserved. Worse, many addresses that are served receive broadband plans that are non-compliant with the FCC’s 10 Mbps download speed requirement. These results highlight the fundamental limitations of relying on ISPs’ self-reported data to assess the success of multi-billion dollar policy interventions. They emphasize the need for independent and transparent post-hoc evaluation programs.
Key Attributes of the CAF Program
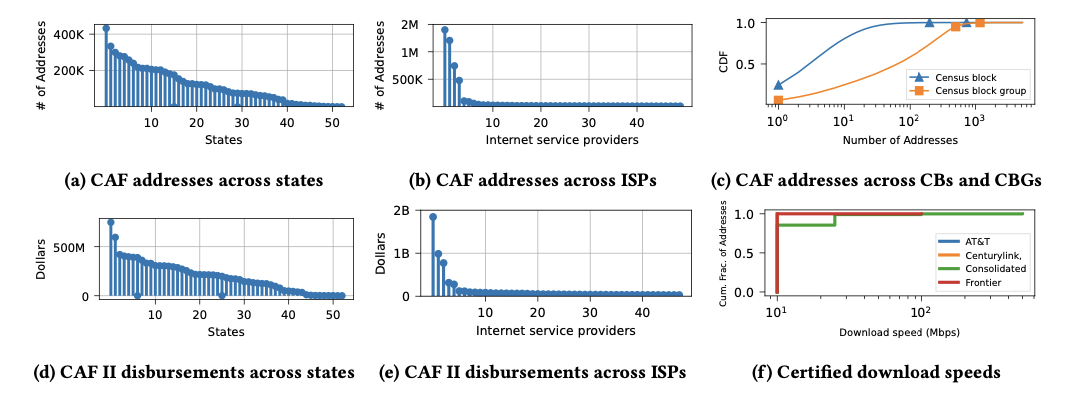
Figure a and Figure d show the state-wise distribution of CAF addresses and disbursed funds, respectively, highlighting a concentration in the top 20 states, which account for over 73% of addresses. Figure b highlights the distribution of addresses certified as served by CAF-served ISPs, while Figure 1e shows fund distribution across ISPs. FIgure c reveals a high variance in CAF addresses per census block, with a range from 1 to over 5k addressses. With a few exceptions, almost all ISPs certify offering a download speed of 10 Mbps (Figure f), which satisfy FCC’s service quality requirements.
Serviceability Rates
To explore whether the service is genuinely avaliable to addresses certified as served by the ISPs through the CAF program, we calculate the serviceability rate. This is a metric we define to quantify the fraction of actively served addresses.
We observed serviceability rates of 31.53%, 70.71%, 90.42%, and 83.95% for AT&T, Frontier, CenturyLink, and Consolidated Communications, respectively. Aggregated across the states, we observed a serviceability rate of 55.45%, meaning that we estimate 55.45% of the addresses in these states (certified as served by the CAF ISPs) are actually served by the ISPs.
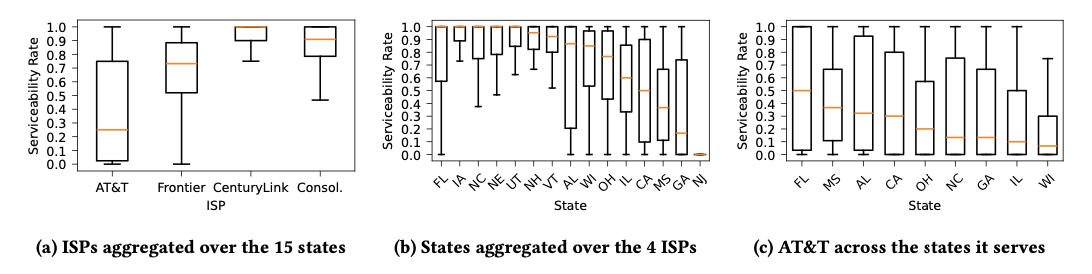
Figure a shows the serviceability rate at the granularity of census block groups. Figure b highlights the distribution of serviceability rates across different census block groups for all 15 states. As seen in Figure c, there is a significant variability in AT&T’s serviceability rates across the nine states it serves.
Compliance Rates
To assess whether consumers are offered broadband plans from ISPs that meet the FCC’s minimum rate and service quality standards set for the CAF program, we calculate the compliance rate. This is a metric we define to represent the fraction of actively served addresses that comply with the FCC’s rate and quality requirements.
We observe an aggregate compliance rate of 33.03%. We observe compliance rates of 16.58%, 69.30%, 15%, and 85.56% for AT&T, CenturyLink, Frontier, and Consolidated Communications, respectively.
Regulated Monopolies
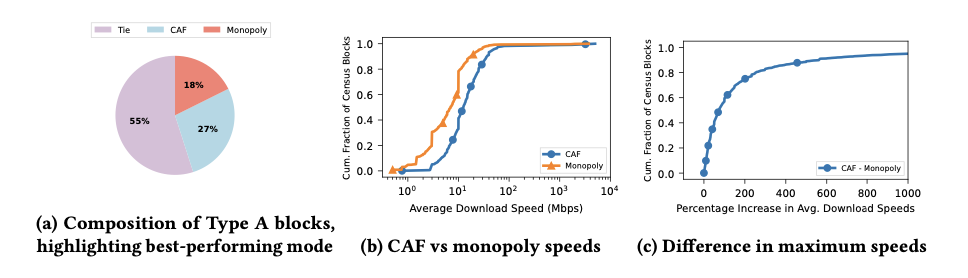
The figure above compares regulated monopolies (CAF) in Type A (CAF+Monopoly) census blocks. Figure b shows the distribution of the average maximum download speeds for CAF-and monopoly-served addresses across Type A census blocks where CAF addresses fare better. To quantify the improvement of CAF over their monopoly counterparts, we compute, for each census block group, the percentage increase of CAF download speeds over monopoly download speeds (Figure c).
These findings are especially timely as we are in the midst of investing another $42.5 billion into broadband infrastructure through the BEAD program to enable “Internet for All.” We need to make the recipients of these funds more accountable. It is crucial to ensure that these multi-billion dollar programs are truly effective in realizing their intended goals.