Analyzing Disparities in Broadband Plans
Digital equity in Internet access is often measured along three axes: availability, affordability, and adoption. Most prior work focuses on availability; the other two aspects have received little attention. In this work, we study broadband affordability in the US. Specifically, we focus on the nature of broadband plans offered by major ISPs across the US. Leveraging BQT that obtains broadband plans (upload/download speed and price) offered by seven major ISPs for any street address in the US. We then use this tool to curate a dataset, querying broadband plans for over 837 k street addresses in thirty cities for seven major wireline broadband ISPs. We use a plan’s carriage value, the Mbps of a user’s traffic that an ISP carries for one dollar, to compare plans.
Specifically, we aim to answer the following questions: (1) Do the broadband plans, characterized by their carriage value, change by the city (inter-city) for different ISPs? (2) Does the carriage value change within a city (intra-city)? If yes, which neighborhoods (identified by their census block groups) receive good and bad deals (high and low carriage values)? (3) Does competition among ISPs impact the carriage value offered to the end users? If yes, is there a trend in which neighborhoods experience competition? (4) Is the quality of available deals affected by demographic and socioeconomic factors? If yes, which population groups receive better or worse deals from the ISPs?
This work has been accepted for publication in the upcoming ACM SIGCOMM 2023 conference. Read the full paper here.
Inter-City Broadband Plans
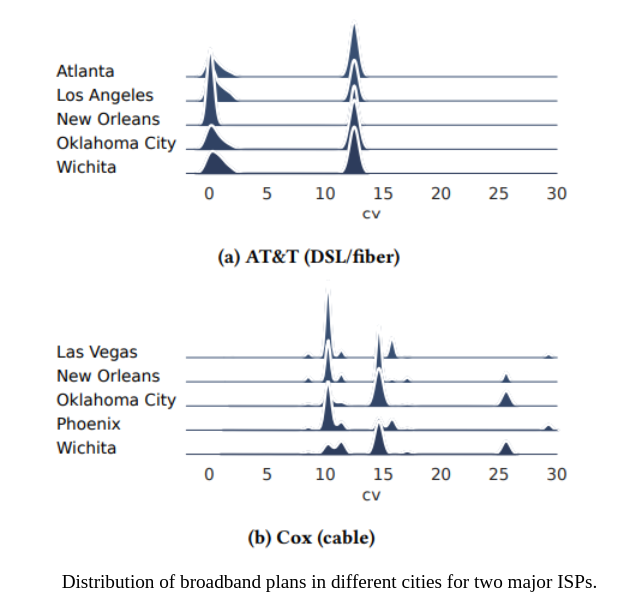
As shown in above figure, ISP plans vary inter-city. Our analysis reveals up to 60% of the census block groups in a city can receive low carriage value plans from an ISP.
Intra-City Broadband Plans
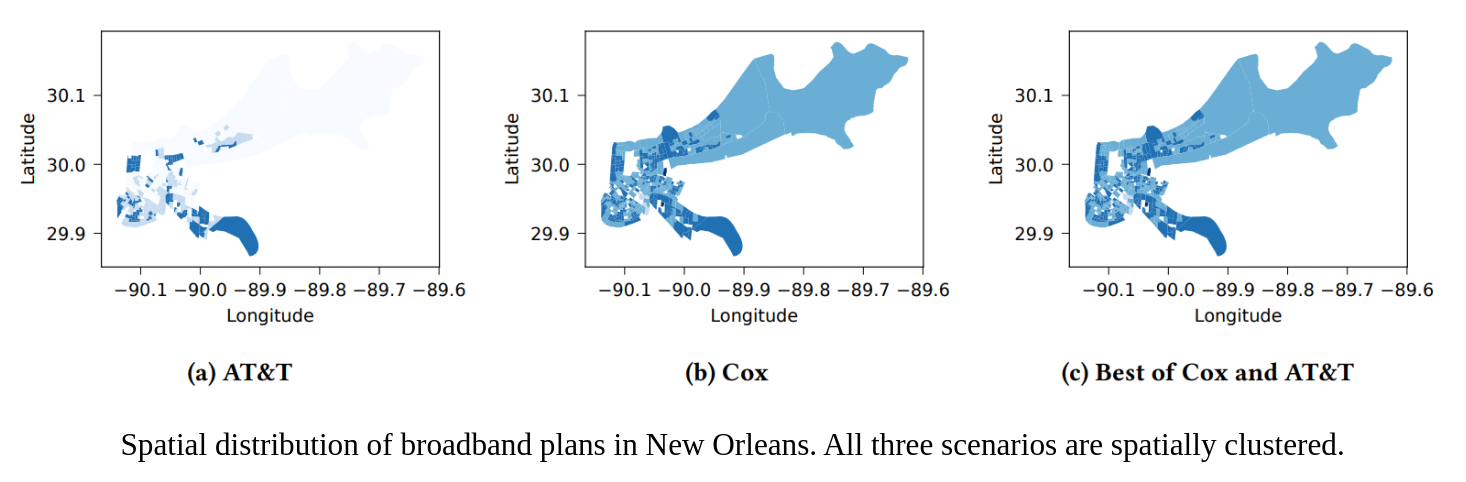
Our work shows that ISP plans intra-city are spatially clustered as demonstrated in the figure above for AT&T and Cox in New Orleans. Additionally, the carriage value can vary as much as 600% for an ISP within a city.
Impact of Competition on Broadband Plans
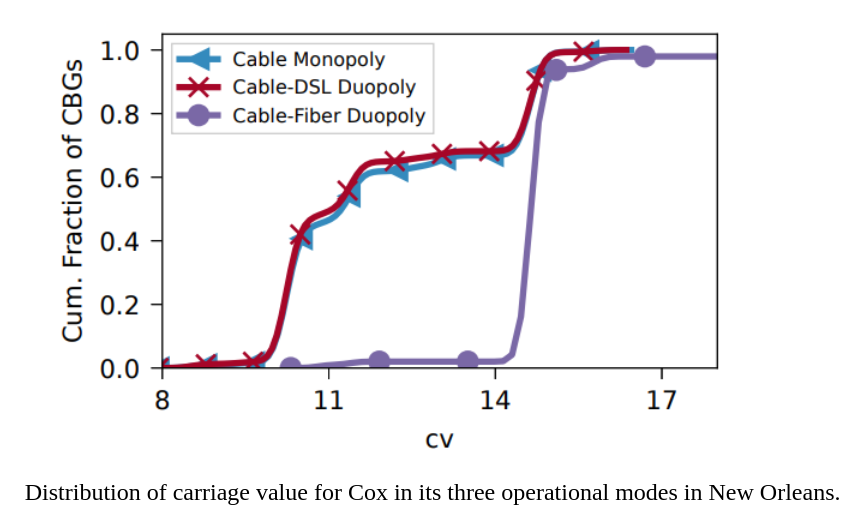
Through our analysis, we find that competition among ISPs offering similar level of service in a census block group lead to better carriage value for the users. As can be seen in the figure above, the carriage value for Cox increases by 30% in New Orleans when it competes with AT&T’s fiber offerings in comparison to when it either exists as a monopoly or competes with AT&T’s DSL offerings.
Influencing Socioeconomic Factors
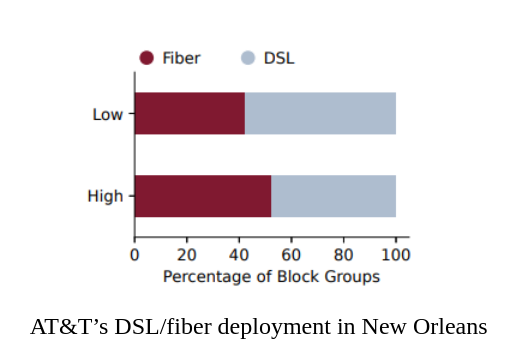
Figure above presents the breakdown of the percentage of block groups that receive AT&T’s DSL and fiber plans in the two income categories of block groups in New Orleans. 41% of the low-income census block groups receive AT&T’s fiber plans while 57% of the high-income block groups in have fiber plans available. Across 14 cities where we collected AT&T plan data, the fiber deployment gap between the high-income and low-income block groups exceeds 10% in 7 cities, while in 4 cities it is below 10%. No difference is observed in Austin, TX. However, in Wichita, KS, and Atlanta, GA, a higher proportion of low-income census block groups receive fiber from AT&T compared to high-income groups. We conducted a similar analysis for the demographic attributes of race and population density. The results for these variables did not produce similar trends across cities for all ISPs.
Our results stress the importance of having fiber connectivity for all population groups. Given that the lack of fiber also leads to lower cv from cable providers, the internet users of the block groups that lack fiber connectivity tend to get more bad deals overall compared to others.